

Linux Syscall Tracing: Find Latency in 3 Steps
Start with the one syscall that is slow, not the whole machine. Tracing latency issues on Linux means catching your process at the kernel boundary and asking where the time went: an I/O wait, a lock, a slow disk, or a syscall that returns fast but gets called ten thousand times. Get that split right and you fix the real layer. Get it wrong and you spend the night tuning a database that was never the problem.
Last updated: 2026-07-21
How do I start tracing latency issues on Linux?
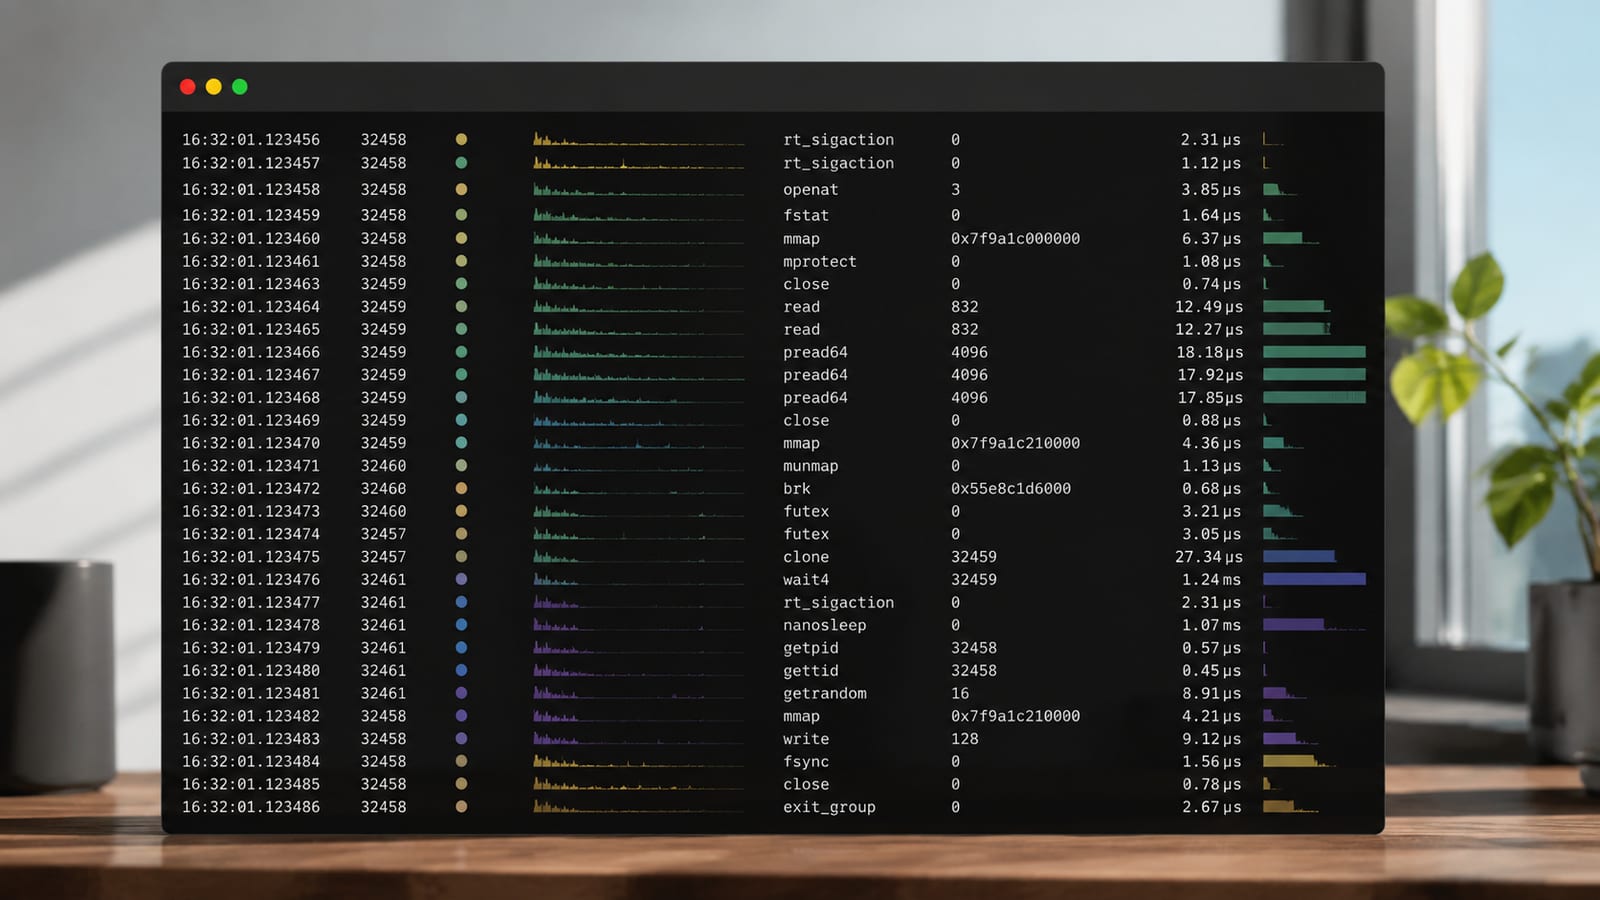
Run strace -c -T -p $PID for thirty seconds first, then read the summary. That one command tells you which syscall eats the most wall time and how many times it fired, before you touch anything heavier. The -c flag aggregates, and -T records time spent inside each call. If one syscall dominates the total, you have your suspect. If nothing dominates and the process still feels slow, the delay is off-CPU: scheduling, a mutex, or waiting on another machine.
Here is what I never do: reach for a full eBPF build toolchain to answer a question a summary count already settles. Start at the top of the stack with the cheapest tool that gives an answer, and only go deeper when it runs out of room.
The order I work in stays the same every time. Confirm which syscall is hot, confirm whether the time is on-CPU or waiting, then attribute it to a code path. Skip a step and you end up guessing.
How long does a syscall take?
A single system call on Linux costs roughly 1 to 2 microseconds of pure overhead, meaning the cost of crossing into the kernel and back with no real work done. That is your floor. It sounds like nothing until a hot loop makes the call a million times.
Common calls do more than cross the boundary. A read, write, or open on a modern Linux box is fast enough that the syscall boundary itself is rarely the cost – the work behind it is. So the math that bites you is volume, not per-call cost. A call that runs often enough can still add up to a full CPU core spent in the kernel.
This is why raw counts matter as much as durations. A call that looks cheap per invocation can still own your latency budget if the code hammers it. When I read a trace, I look at total time in a syscall, not just the slowest single instance. The outlier is interesting; the sum is what pays your latency bill.
strace for quick answers, never on production
Reach for strace in development or a short reproduction, and get it off any live service fast. The reason is not politeness. strace uses ptrace and stops your process on every single syscall, and that can run a workload up to about 173 times slower than normal. On a busy production box that is not tracing, that is an outage.
For quick work the flags that matter are few. Use -T for per-call timing, -t for wall-clock stamps, and -c for the aggregate summary. Narrow the noise with -e trace=open,read,write,connect so you watch only I/O and network calls instead of everything.
strace -f -T -e trace=network -o trace.log -p $PID
Add -f to follow forked children, and -o to save raw output so you can slice it later with grep and awk. When you read the log, scan for negative return values and errors like ETIMEDOUT or ENOENT, then check the duration in the trailing angle brackets. That number after the call is the time it held your process. For the full flag list, the strace manual page is the authority, not the top forum answer.
perf trace when the box has to stay up
Use perf trace on live services because it samples instead of stopping every call. It does not halt your process at each syscall the way strace does, so the overhead is a fraction of the cost. That is the whole reason it exists for production work.
Point it at long events first. perf trace --duration <ms> prints only syscalls that ran longer than the threshold you set, which is fast triage when something is stalling. For a per-process breakdown, perf trace -p $PID -s gives totals, error counts, and average timings in one shot.
When you need to know which code called the slow path, capture stacks:
perf trace record --call-graph dwarf -p $PID -- sleep 10
One thing worth knowing: perf record samples at 4000 Hz by default, meaning 4000 samples per second. That default is a sane trade between resolution and overhead for most profiling. If you are chasing rare spikes you can raise it, but you pay for every extra sample in CPU. For deeper profiling work, my notes on profiling kernel performance with eBPF cover where perf hands off to lower-level tools.
What bcc syscount tells you fast
Run syscount-bpfcc -L when you want a latency histogram without writing any C. The BCC syscount tool counts syscalls system-wide with almost no overhead, and the -L flag adds total time per syscall type. That answers "which call is expensive across the whole box" in one line.
The flags I lean on:
syscount-bpfccalone: live count of every syscall by type, top talkers first.-L: add total latency per syscall, so a rare-but-slow call stops hiding.-p $PID: scope to one process instead of the whole system.-i 1: refresh every second so you watch it move while you reproduce the problem.
Because BCC attaches an eBPF program to a tracepoint rather than stopping the process, you can leave syscount running on production without the strace penalty. It will not give you per-call arguments the way strace does. It will tell you where to point the heavier tools, which is usually all you need to stop guessing. If you are new to these tools, getting started with bcc tools walks the setup. The BCC project documentation lists every tool in the kit.
Getting a kernel call trace for the slow path
A count tells you which syscall is slow; a kernel call trace tells you why. When a syscall like read shows high latency and you cannot explain it from user space, you need the in-kernel call path. Two tools get you there without building a module.
Use perf trace record --call-graph dwarf to capture user and kernel frames together, then read the tree from the slow syscall down into the kernel functions it entered. For a pure kernel-side view, ftrace through the trace-cmd front end records the function graph inside the kernel. That shows whether your read is blocked in the block layer, a filesystem lock, or waiting on the network stack.
The trap here is reading the whole trace. A kernel call trace on a busy system is thousands of lines, most of them irrelevant. Narrow the scope to the subsystem you already suspect before you record, or you drown. When a slow path crosses into the kernel this often, writing a small custom probe pays off, and I keep a working pattern in tracing system calls with eBPF.
Which tool fits which job

Match the tool to the environment, not to whichever one a blog post praised. The split I actually use:
| Tool | Overhead | Best for | Skip it when |
|---|---|---|---|
strace | Very high (up to ~173x slower) | Dev boxes, short reproductions, seeing exact arguments and errno | The service is live and taking traffic |
perf trace | Low, sampled | Production triage, long-event hunting, per-process stats | You need every argument on every call |
BCC syscount | Very low | Always-on system-wide latency counts | You need the in-kernel call path |
ftrace / call-graph | Medium | Kernel call trace for one subsystem | You have not narrowed the scope first |
None of these is a general answer. strace on production is an outage waiting to happen; syscount on a dev box is overkill when strace -c shows the same hot call and the arguments too. Pick the lightest tool that answers the exact question in front of you.
When the delay is not a syscall at all
Stop tracing syscalls when the summary shows no single call dominating and the process still stalls. That pattern means the time is off-CPU: the scheduler parked your thread, a lock is contended, or you are waiting on hardware or another host. Syscall latency tools will not see it, because the time is spent not running.
At that point I switch to off-CPU analysis and scheduler latency instead. perf sched and off-CPU flame graphs show where a thread sleeps and for how long. A firmware stall, like a System Management Interrupt stealing the CPU out from under Linux, will not show in any syscall trace either; it needs a dedicated latency detector. Knowing which of these you are chasing saves the hour people lose poking the wrong layer. For cutting steady kernel cost once you find it, reducing kernel overhead with eBPF covers the follow-through.
FAQ
Can I trace syscall latency inside a container without knowing the PID?
Yes. Use a cgroup-aware tracer like traceloop, or filter a BCC tool by the container's cgroup. These follow the cgroup v2 hierarchy, so the trace tracks the pod or service slice even as processes fork and exit. PID targeting breaks the moment the container restarts; cgroup filtering does not.
How do I trace latency that only happens at startup, before I can attach?
Set the tracer to launch the program rather than attaching after. strace -f your-binary and perf trace -- your-binary both trace from the first instruction, forks included. For eBPF tools, attach to the tracepoint and start the process second, since the probe is already live system-wide.
Does adding -T to strace change the timings it reports?
The durations -T reports are the kernel time for each call, but the ptrace stops inflate everything around them. Treat strace timings as relative, useful for ranking which call is slowest, not as absolute numbers. When you need trustworthy wall-clock latency, measure with perf trace or a BCC histogram instead.
Why does my syscall count look huge when the program feels idle?
A tight poll loop or a library retrying on EINTR will fire thousands of harmless calls a second. Run syscount -L and check total latency, not just count. High count with low total time is cosmetic; high count with high total time is your problem. The number that matters is time spent, not calls made.
