
Use eBPF to Trace VPN Traffic Across Encryption
The right eBPF hooks expose plaintext on tun0 or wg0 and ciphertext on the NIC, with practical guidance on correlation, probes, and failure diagnosis.
The right eBPF hooks expose plaintext on tun0 or wg0 and ciphertext on the NIC, with practical guidance on correlation, probes, and failure diagnosis.

Skip dashboards for unreliable counts. Start with /proc/net/dev and tc qdisc, then layer nlbwmon for per-IP accountability on OpenWrt routers.
Use bpftrace for a quick question, BCC for repeatable scripts, perf for traditional sampling, and Rust with Aya only when existing tools cannot express.
Kernel overhead drains CPU cycles through privilege transitions, context switching, and memory isolation. Learn what causes it and how to measure it yourself.
bpffs mount requires CAP_SYS_ADMIN for both the mount and bpf() syscall. Learn how to diagnose failures, make mounts persistent, and secure pins across reboots.
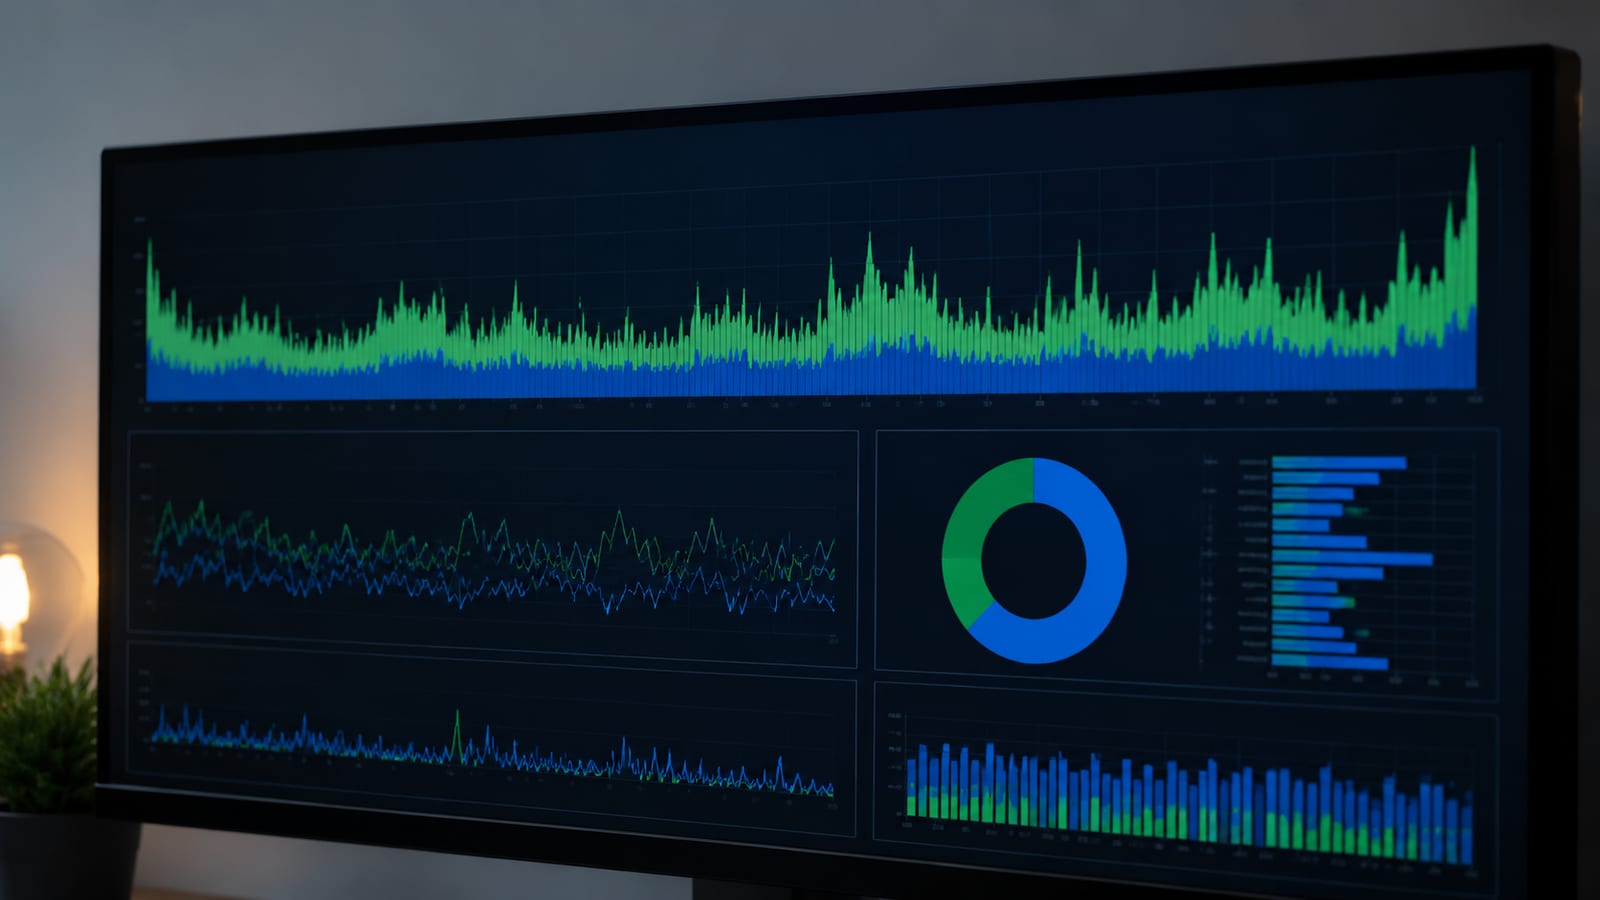
Kernel times show OS overhead on your CPU. Learn what drives them high, how to spot driver problems in Task Manager, and the tools to diagnose the real culprit.
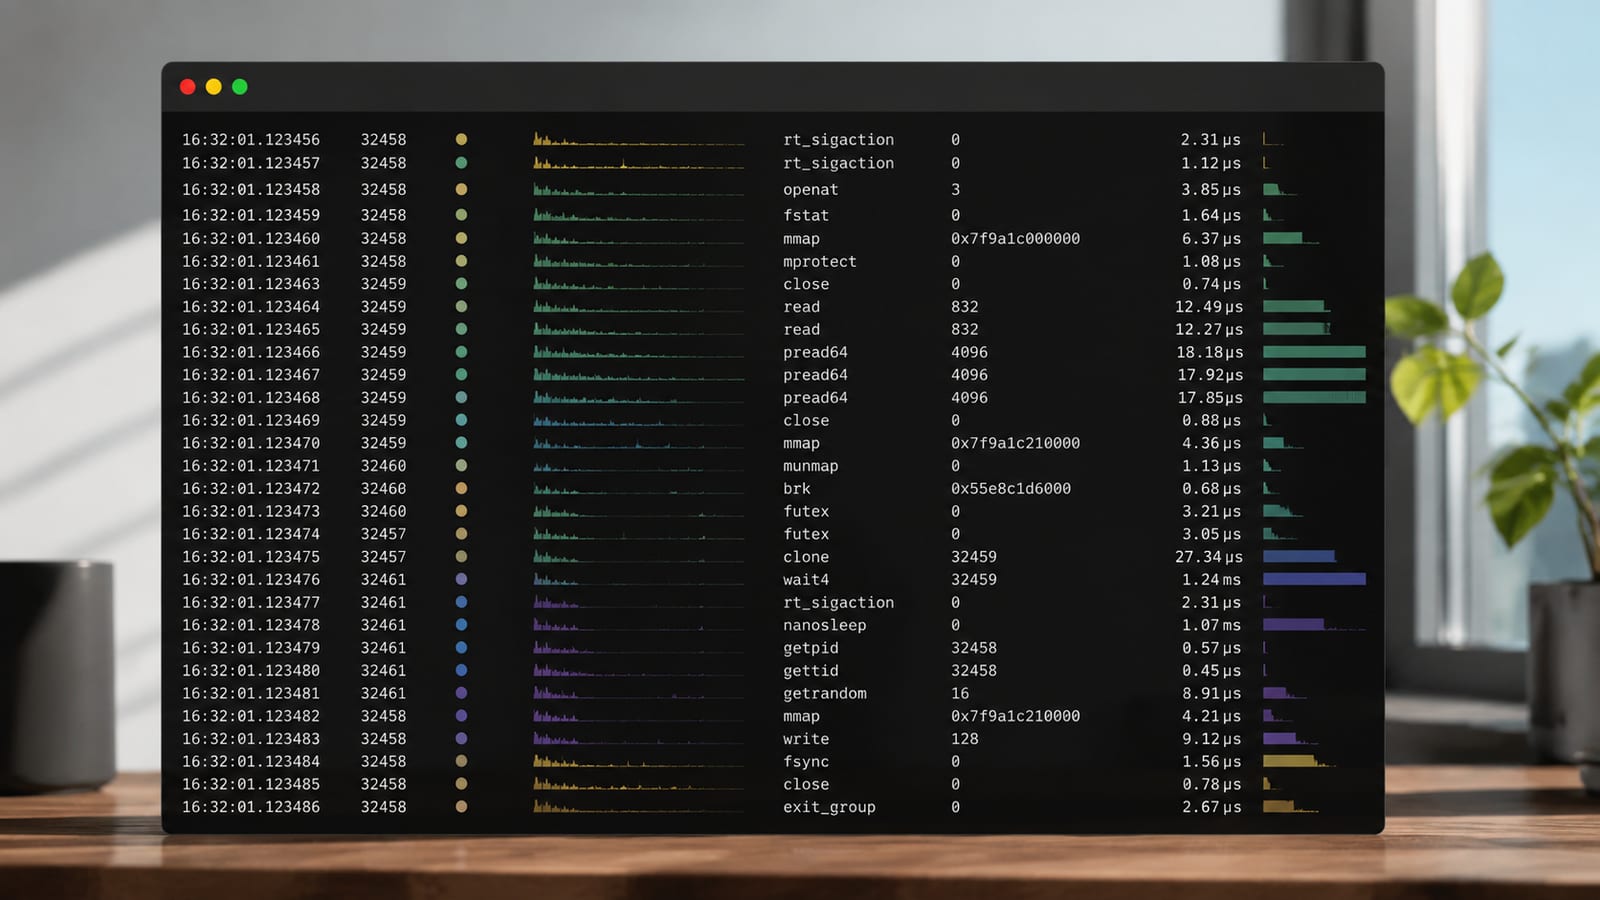
Diagnose Linux latency by tracing syscalls with strace, perf trace, or BCC tools. Learn which tool fits production vs development and how to read the results.
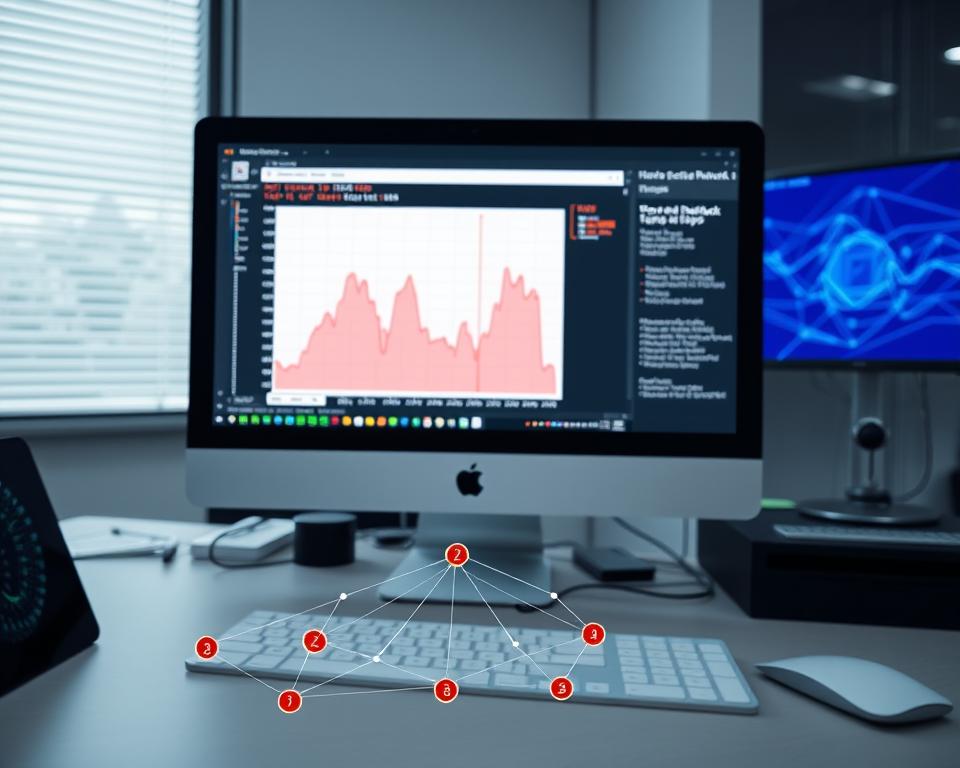
You feel the pressure when network flows stall, and packet drop monitoring eBPF is the fastest way to surface the kernel’s reason for loss so you can act with confidence. We outline a practical path—attach an ebpf program to a tracepoint, capture events at the linux kernel, and export clear flow-level data to dashboards. This […]
