


Optimize a Web Server on Linux VPS: Measure First
There is no instant VPS optimizer worth running blind. Every "automatic" tuning script that rewrites your sysctl, adds swap, and flips on BBR without checking your kernel version, your workload, or your actual bottleneck will either break something quietly or do nothing at all. Real optimization is diagnosis first, change second: read your own metrics with free, vmstat, dmesg, and strace, find the layer that is actually slow, then tune swappiness, enable the right congestion control, and size swap for your RAM. A fix you do not understand is a fix that comes back at 3 a.m.
Last updated: 2026-07-21
I work through four layers in order: system tuning (CPU, RAM, disk, kernel), the web stack (Nginx or Apache and PHP-FPM), the database (MySQL or MariaDB), and monitoring plus security. I measure each change against a real benchmark. Fast means lower time to first byte, steady p95 and p99 response times under load, and fewer error spikes during bursts. Keep changes staged and small, so you can roll back safely.
What optimizing a VPS actually means
Optimization is not a script you run once. It is a loop: measure, form a theory about the bottleneck, change one thing, measure again. Skip the measuring and you are just cargo-culting settings off a forum thread that matched someone else's box, not yours.
The fastest wins I see, in order: fix memory pressure first, then add caching, then hunt slow queries, then scale out only if a single machine truly limits you. Most people invert this. They buy more vCPU before they have looked at whether the box is swapping. More cores do nothing for a server that is paging to disk.
So the first move is always to look, not to tune. The rest of this article is the looking, then the tuning, in that order.
Start with a baseline so you can prove each improvement
I start by measuring a real endpoint so every change has proof. Pick a page or route that matches user traffic: a login, a product page, a hot API route. Run quick sanity checks with practical tools: sysbench for CPU, fio with direct I/O for storage, and iperf3 for network between hosts. These show where the bottleneck lives.
Load test the target with wrk or ApacheBench. Record p50, p95, and p99, not just the average. Tail latency is the number your users feel. Note your current limits too: ulimit -n, systemd service caps, free disk, and open files. Capture live usage (CPU, RAM, swap, I/O) while the test runs.
Keep the tests quick and repeatable. You will re-run them after every change to catch regressions early. If you are still choosing where to run this, my notes on how to choose a VPS for Linux development cover the sizing tradeoffs before you commit.
Should you trust a VPS optimizer script downloaded and run without review?
Only after you have read it, and only for the two or three settings you already understand. Most of these bash scripts do the same handful of things: set vm.swappiness, add a swap file, bump network buffers, and enable BBR. None of that is secret, and none of it should be applied sight unseen.
Here is what actually goes wrong. A script sets net.core.default_qdisc=fq and net.ipv4.tcp_congestion_control=bbr on a kernel too old to have the BBR module, so the setting silently fails and you think you are running it. Another sets vm.swappiness=0 on a database box and hands you the OOM killer during your next traffic spike. A third raises somaxconn to a huge number on a machine with 1 GB of RAM and buys you nothing but a bigger accept queue.
A reviewed script is fine. Read every line, understand each sysctl key, confirm your kernel supports it, and apply through /etc/sysctl.d/ so the change is auditable and reversible. The problem was never the script. The real problem is running it blind.
How do you tell if RAM is actually your bottleneck?
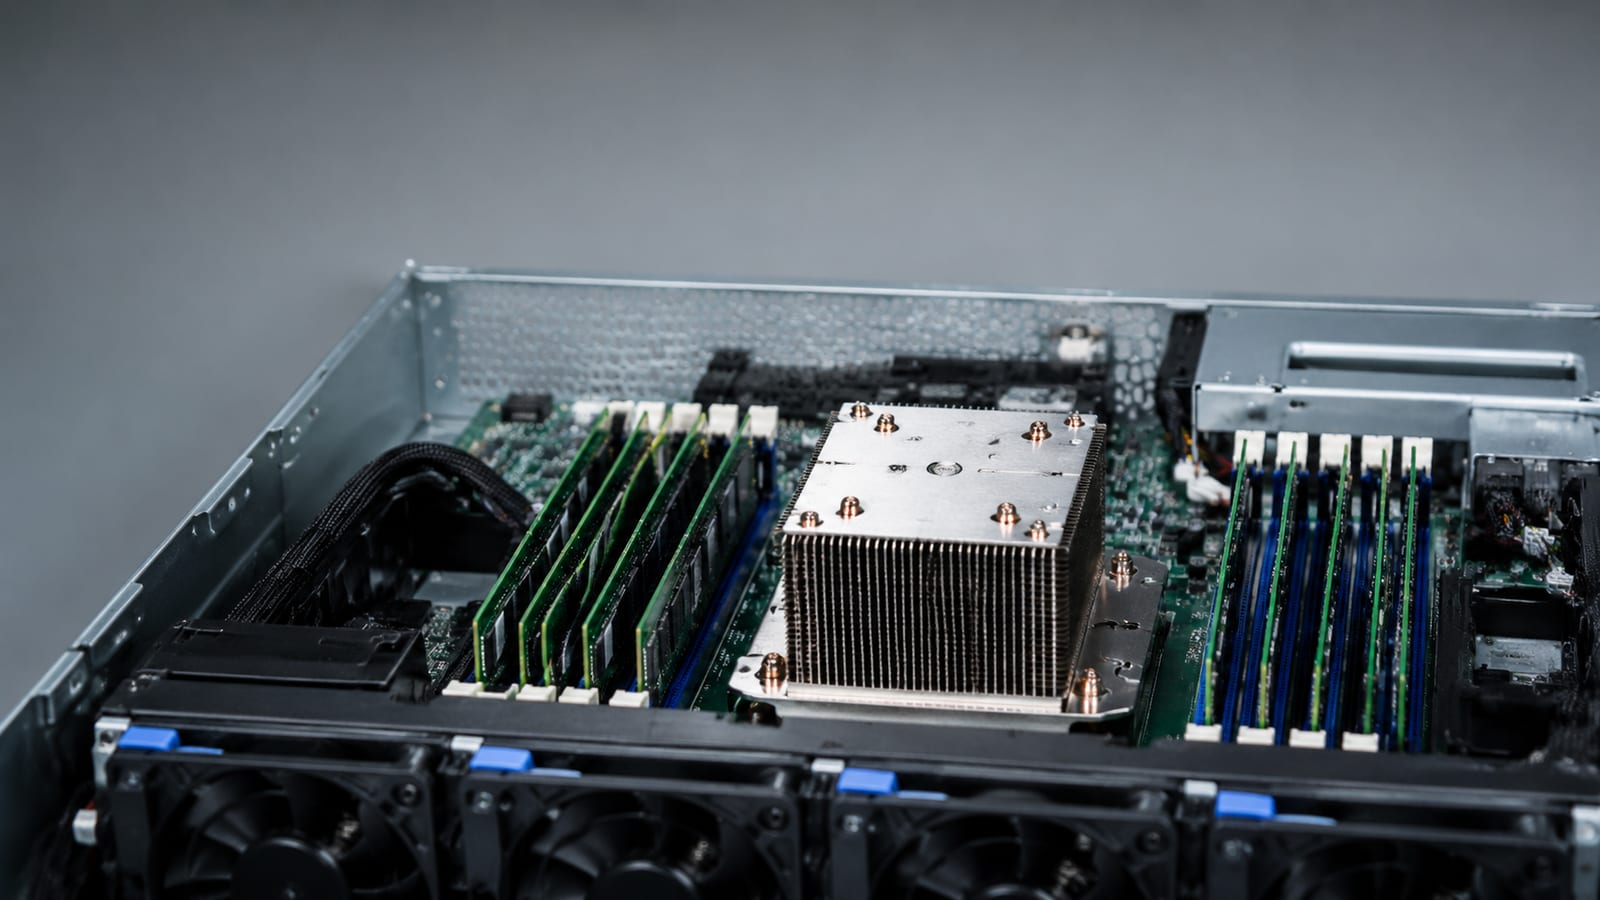
Run free -h first, and read the available column, not free. Linux uses spare RAM for page cache on purpose, so a low free number is normal and healthy. The available figure is the memory your apps can actually claim without paging. If that stays comfortable, RAM is not your problem and adding more is money wasted.
The number that tells the real story is swap activity, and for that you use vmstat 1:
vmstat 1
Watch the si and so columns (swap in, swap out). If they sit at zero, you are not memory-bound no matter how scary free looks. If they climb steadily under load, the box is thrashing and every other metric is lying to you. That tells you to fix memory before you touch anything else.
For the per-process picture, check /proc/meminfo for the totals and ps aux --sort=-%mem | head for the biggest consumers. When one process balloons over time, attach strace -p <pid> and watch for a leak or a runaway allocation. Confirm the leak from the source before you paper over it with more swap.
Cutting RAM usage on a Linux VPS
Kill the memory hog you found, do not just feed it. If ps and strace point at a PHP-FPM pool spawning too many workers, the fix is fewer pm.max_children, not more RAM. Too many workers with too little RAM is the classic swap storm: every request piles on, the box pages, and the whole thing grinds. Size the pool to memory you actually have.
Trim standing services next. List what is enabled with systemctl list-unit-files --state=enabled, then stop and disable what you do not use, and apt purge or yum remove the package so it stays gone. A mail agent, a printing daemon, or a bundled monitoring stack you never opened is memory and background wakeups you get back for free. Verify SSH access before and after, and test an alternate session first so a bad change cannot lock you out.
For the database, the single biggest lever on a MySQL or MariaDB box is the InnoDB buffer pool. The MySQL manual on the InnoDB buffer pool recommends sizing it to around 80% of physical memory on a dedicated database server, so the hot working set stays in RAM instead of hitting disk. On a shared box, size it lower and leave headroom for everything else.
How should you size and configure swap on a VPS?
Add swap as a safety net, not as a substitute for RAM. Swap buys you time during a spike so the kernel pages cold memory instead of invoking the OOM killer and shooting your database. It does not make a memory-starved box fast. If you are swapping constantly, that is a sizing problem, not a swap problem.
For sizing on a Linux VPS, a workable rule: swap should be twice the size of RAM if you have under 2 GB, and RAM plus 2 GB once you have more than that. So a 1 GB box gets 2 GB of swap, and an 8 GB box gets 10 GB. Adjust down if disk is tight, but keep some.
Create a swap file rather than repartitioning:
fallocate -l 2G /swapfile
chmod 600 /swapfile
mkswap /swapfile
swapon /swapfile
Add it to /etc/fstab so it survives a reboot. Then set vm.swappiness=10 in /etc/sysctl.d/. That low value tells the kernel to prefer reclaiming page cache over pushing application memory to disk, which is what you want on a server. Do not set it to 0; that disables the cushion you just built. On small-RAM plans, zram (compressed swap in RAM) often beats disk swap when your storage IOPS are limited.
Is BBR worth enabling on your VPS?
Yes, on a public-facing server that pushes data over long or lossy links, BBR is one of the few "just enable it" wins. BBR is a TCP congestion control algorithm from Google that models the network's bandwidth and round-trip time instead of treating every packet loss as congestion. On a path with even light loss, the old default (CUBIC) backs off hard and your throughput collapses. BBR holds the line.
Enable it by setting two keys and reloading:
net.core.default_qdisc=fq
net.ipv4.tcp_congestion_control=bbr
Then verify it actually took, because a failed set is silent:
sysctl net.ipv4.tcp_congestion_control
cat /proc/sys/net/ipv4/tcp_available_congestion_control
If the first command does not print bbr, your kernel does not have the module loaded and the setting did nothing. BBR is not a cure for a slow disk, an overloaded CPU, or a memory-bound box. It fixes throughput and latency under packet loss. If your bottleneck is elsewhere, enabling it changes nothing, and now you have a false sense that you "optimized the network."
Is BBRv3 or the XanMod kernel worth installing?
For almost everyone, no. Stock kernel BBR already gets you the big win. BBRv3 exists and it does improve on the original in loss handling and fairness, but it ships on a custom kernel like XanMod, and a custom kernel is a maintenance commitment you take on forever.
Here is the tradeoff nobody mentions. Once you replace the distribution kernel, you own kernel updates. Your provider's security patches and your package manager's automatic upgrades no longer cover the piece most likely to sit between you and a remote hole. You are trading a measurable-but-modest network gain for a standing chore and a bigger blast radius on the day a kernel bug lands.
Install a custom kernel for BBRv3 only if you have measured that TCP throughput under loss is genuinely your bottleneck, you run enough traffic for the difference to matter, and you have a process to keep that kernel patched. For a normal web VPS, stock BBR on the distribution kernel is the right call. Reach for XanMod when the stock setup runs out of room, not before.
The kernel and sysctl settings that actually matter
Beyond memory and BBR, a short list of sysctl and limit changes earns its place on a busy server. Raise them modestly, apply them through a file in /etc/sysctl.d/, and change one at a time so you can tie any regression to its cause.
| Area | Setting | Sane starting point | What it fixes |
|---|---|---|---|
| Connections | net.core.somaxconn | 1024 | Dropped connections when the accept queue overflows during bursts |
| Backlog | net.core.netdev_max_backlog | 5000 | Packets dropped before the kernel processes them under load |
| TCP buffers | net.ipv4.tcp_rmem / tcp_wmem | leave auto unless proven | Throughput on high-latency links |
| File handles | fs.file-max + systemd LimitNOFILE | per-service, raised | too many open files on Nginx, PHP-FPM, and the DB |
The one people forget is the per-service file descriptor limit. A global fs.file-max bump does nothing if the Nginx or PHP-FPM systemd unit still caps LimitNOFILE low. Raise it in the unit's override, reload, and confirm with cat /proc/<pid>/limits. That tells you the real ceiling the process runs under, not the one you hoped you set.
Also mount busy partitions with noatime in /etc/fstab to cut pointless metadata writes, and check the active I/O scheduler at /sys/block/vda/queue/scheduler. On SSD-backed virtual disks, mq-deadline or none usually beats the rotational default.
How do you verify an optimization actually worked?
Re-run the exact same benchmark you captured at baseline and compare the p95 and p99, not the average. Same endpoint, same tool, same concurrency. If tail latency did not move, the change did nothing useful no matter how good the setting looked on paper. Assuming a tweak helped is how you end up with ten settings and no idea which one mattered.
Pair the benchmark with the logs. Check dmesg -T | tail for OOM kills or driver noise after a memory change, and journalctl -u nginx --since "10 min ago" scoped to the service you touched. When you suspect a change made a process do more work rather than less, strace -c -p <pid> gives you a syscall count summary you can compare before and after.
The discipline that saves you: change one thing, measure, write down the number, then move on. A stack tuned in one big commit is a stack you cannot bisect when it slows down next month.
What to avoid when optimizing a VPS
The mistakes are predictable and they all share a root cause: applying a setting without checking whether it fits this box.
vm.swappiness=0on a real server. It sounds aggressive and fast. It removes your cushion and invites the OOM killer during the exact spike you built swap for. Use10.- Enabling BBR without confirming loss is your problem. If the path is clean and local, BBR changes nothing, and you have skipped the actual bottleneck.
- Swapping to a custom kernel to chase a benchmark number. You inherit kernel patching forever for a gain you probably cannot measure on your traffic.
chmod-ing configs or cranking every buffer to a huge value. Bigger is not tuned. An oversized TCP buffer on a low-RAM box wastes memory you needed for the buffer pool.- Running an instant script and rebooting. A change that only survives because you have not rebooted is a change that will surprise you later.
None of these are exotic. They are just what happens when you copy a setting instead of reading why it exists. When one server genuinely runs out of headroom, that is the moment to put a proxy in front and split roles, and my walkthrough on setting up a reverse proxy on Linux hosting covers that step.
FAQ
Is Brotli worth enabling over gzip on my web server?
For text assets served over HTTPS, yes. Brotli typically produces files 15 to 25% smaller than gzip at comparable settings, which trims bandwidth and speeds delivery of HTML, CSS, and JavaScript. Keep gzip as the fallback for clients that do not advertise Brotli support, and pre-compress static files so you pay the CPU cost once, not per request.
Does adding more vCPU fix a slow VPS?
Rarely, and only if you have proven CPU is the bottleneck with sysbench or by watching load and run-queue under your real workload. A box that is swapping or blocked on disk I/O will not speed up with more cores. Diagnose first with vmstat and free; buy cores only when the CPU is genuinely pinned and everything else is clear.
How do I know if my VPS is disk-bound instead of CPU-bound?
Run iostat -x 1 and watch %util and await on your data device. High utilization with rising wait times means requests are queuing on storage, not compute. Confirm with fio using direct I/O to measure the disk in isolation. If storage is the wall, move write-heavy workloads to NVMe before you touch any kernel setting.
Should I use zram or a swap file on a low-memory plan?
Try zram first when your storage IOPS are limited, since compressed swap in RAM avoids slow disk paging and keeps hot pages reachable. Keep a small disk swap file as well for the genuinely cold pages zram cannot help. On a plan with fast NVMe, a plain swap file is simpler and usually enough.
Can I safely apply these changes on a production server?
Apply them in staging first, one at a time, then roll to production in small reversible steps. Put every sysctl change in /etc/sysctl.d/ so it is auditable and easy to remove, and test an alternate SSH session before you log out after any change that touches limits or networking. Reboot once at the end to confirm everything survives a restart, because a setting that only holds until reboot is not really set.
Related on this blog
Related: A Practical Iperf3 Method for Linux Server Speed Tests
