


eBPF JIT Verification Offload Tutorial for Linux Kernel Experts
I tested an eBPF JIT verification offload design because load-time checks slow my workflow—and I wanted a safe, auditable path that kept runtime behavior unchanged. I felt the tension: native machine code running in kernel mode is powerful, and a single bad decision can break security or memory safety.
Here I state the key idea plainly: move parts of the verifier analysis out of the kernel while preserving the kernel’s final safety gate. I describe an offloader that consumes BPF program bytecode and metadata, then returns structured results that the kernel rechecks before acceptance.
My scope is narrow: this is for kernel experts who know BPF basics and want a reviewable design. Expect practical proof points—matching load-time decisions, identical runtime behavior, clear reject text for operators, and measurable performance wins without weakening kernel checks.
Key Takeaways
- I explain the concept: external analysis, in-kernel final check.
- I outline the threat model: native code in kernel mode matters.
- I show the artifact: an offloader that returns structured verifier results.
- I commit to proof: identical runtime behavior and matched load-time decisions.
- I refuse to trust user space blindly or weaken kernel gates.
What verification and JIT compilation protect in the Linux kernel
When a program becomes native machine code and runs in kernel mode, I demand proof before execution. The kernel must not trust unvetted code: a single bad instruction can corrupt memory or leak sensitive data.
The verifier enforces concrete rules so the system stays stable. It forces bounded memory access, initialized stack reads, valid jumps, termination guarantees, and correct helper usage per program type.
Common failure modes the verifier prevents
- Memory corruption that overwrites kernel structures and causes crashes.
- Information leaks that expose kernel pointers or credentials.
- Non-terminating paths and hangs that stall hot paths and raise tail latency.
- Deadlocks from incorrect lock use that halt system threads.
Why load-time checks beat heavy runtime checks
I pay verification cost once at load time so runtime stays near-native and cheap. More runtime checks slow hot paths, increase CPU usage, and worsen latency for the whole system.
Many rules depend on program type: network hooks get strict packet bounds; tracing hooks get controlled helpers. The verifier also bounds state exploration to prevent DoS from a malicious load.
Scope, assumptions, and what “offload” means in this tutorial
I move heavy analysis out of the kernel load path—but I keep the kernel as the final authority. Simple rule: analysis can run elsewhere, but the kernel makes the accept/reject call and enforces any gates tied to kernel state.
What I moved off the load path
I shifted tasks that are expensive but non-decisive: control-flow graph building, wide state exploration, and producing structured per-instruction diagnostics. These speed the load-time analysis without changing runtime behavior.
What must run in the kernel every time
The kernel rechecks capability decisions, helper allowlists for the current program type, map FD validation, and hard verifier limits. These checks are cheap and decisive—so they stay inside and run every time a program loads.
- Trust boundary: user space and external services are untrusted.
- Mitigation: kernel revalidates minimal invariants to catch a lying offloader.
- Risk note: a single missing range check or helper mismatch can break security.
| Moveable Work | Kernel-Enforced, Every Time | Why |
|---|---|---|
| CFG construction | Helper allowlists | CFG is heavy; allowlists depend on kernel state |
| State exploration & diagnostics | Map FD validation | Exploration aids tooling; FD checks need kernel truth |
| Structured error reports | Hard limits (states/instructions) | Reports speed triage; limits prevent DoS |
Prerequisites for kernel-side work and a repeatable test setup
I set up a controlled kernel environment so I could measure load-time work and isolate runtime effects.
Kernel config and tooling
Enable verifier and native compilation logs in the linux kernel config. I turned on dynamic BPF logging and kept boot-time debug enabled to capture messages at load time.
Use a recent clang/LLVM to build BPF objects. Use libbpf-based loaders to call BPF_PROG_LOAD and attach programs. Keep kernel dmesg and trace output open for human-readable diagnostics.
Choosing a program type and hook
I picked one program type per experiment. That kept helper rules and context layout stable across runs.
Compare hooks: XDP for early network path, TC for later packet processing, and tracepoints or kprobes for observability. Start simple—fewer helpers, smaller context—so disagreements are easier to debug.
| Goal | Selected Hook | Why |
|---|---|---|
| Early packet path | XDP | Minimal context; fast execution for network tests |
| Post-stack processing | TC | Richer helpers; tests tail latency effects |
| Observability | kprobes/tracepoints | Access kernel context; validate helper rules |
I used user-space loaders that replay the same program each time to test regressions across kernel builds. I also collected simple timings to separate load-time work from hook execution.
A quick refresher on the eBPF execution model you will depend on
Before we dive deeper, you need a tight mental model of the VM, registers, and context rules. I keep this short—only what later verifier and integration work must match exactly.
Bytecode and the virtual machine
Think of bytecode as a compact instruction stream the kernel reads and then compiles to native machine code. It is a 64-bit RISC-style virtual machine: simple instructions, fixed widths, and predictable behavior.
Registers, stack, and calling conventions
The model uses 11 registers: r0–r10 and a 512-byte fixed stack. r0 holds function returns. r1–r5 are call arguments—r1 is typically the context pointer.
Registers r6–r9 are callee-saved. r10 is the stack pointer. Offload logic must reproduce these roles when tracking “state.”
How hooks drive execution and why context varies
Programs run when a hook fires: a packet arrives, a tracepoint triggers, or a probe hits. Each hook provides a different context pointer and layout.
That matters: allowed offsets, helper availability, and pointer types change by program. Reusing one rule set across program types usually breaks checks.
- I mapped registers so later state tracking is clear.
- I emphasized that bytecode is what the kernel verifies and compiles.
- I warned that context rules differ by hook and must be honored exactly.
How the verifier actually reasons about an eBPF program
I explain the concrete steps the verifier uses to accept or reject a program. Start simple: build a control-flow graph, then walk each path. I keep it hands-on—what I traced in real reviews.
Control-flow graph and unreachable code
The verifier walks branching instructions and builds a CFG. Dead paths get rejected. I do this because unreachable code can hide exploit chains.
Register, stack, and range tracking
The core unit is a state: register types, stack slots, provenance, and numeric bounds (example: smax32 ranges). Ranges split at branches—10–30 becomes two states: 10–20 and 21–30.
Branches, linked registers, and nulls
Each branch forks state and queues work. That multiplies costs and drives instruction inspections until limits stop explosion. The verifier also links registers—copying a packet pointer preserves bounds across moves.
Map lookups yield possible NULL. The verifier forces a check before dereference—no optimistic assumptions. Type tracking feeds helper and memory rules; it is decisive, not lint.
| Concept | What is tracked | Why it matters |
|---|---|---|
| CFG | Branch targets, unreachable nodes | Prevents hidden exploit chains |
| State | Registers, stack, bounds, types | Accurate reasoning about memory and helpers |
| Branching | Queued states, limits | Controls verification time and DoS risk |
| Map results | Nullable pointers | Forces null checks before use |
I matched these rules in my offload model. If your external tool differs, the kernel will catch mismatches—or it will reject safe code. Both outcomes are costly; mirror the kernel’s state model exactly.
Where to integrate eBPF JIT verification offload in the program load path
I anchor the design at the syscall that carries full program truth: bpf() with BPF_PROG_LOAD. That is where the kernel has metadata, permission context, and map handles. Keep the final decision here—always.
Phases I used
Parse attributes and validate maps and types. Then run external analysis before the kernel’s pre-JIT checks. If the kernel accepts, it proceeds to compile the code to native form.
What the external component must return
The kernel needs structured results, not a simple ok. I return: accept/reject, failing instruction index, and a summary of final states.
| Return Field | Purpose | Kernel Sanity Check |
|---|---|---|
| accept/reject | Primary decision | Compare to local policy and caps |
| fail index | Pinpoint offending instruction | Reproduce human-readable error |
| final states summary | Register/stack types and ranges | Validate helper usage and context accesses |
Keeping limits and runtime unchanged
The kernel still enforces instruction and state caps. I added timeouts on external analysis to avoid turning load-time DoS into an external service attack.
The off-path work speeds load time without altering runtime checks. The kernel repeats quick sanity checks and then compiles identical runtime code.
Designing the offload interface: inputs, outputs, and trust boundaries
I needed a small, testable API: clear inputs, firm outputs, and explicit trust rules. The kernel must remain the final arbiter—so every external result is treated as untrusted data and rechecked.
Minimum input set
The request payload must include the program bytecode, the program type and expected attach type, map metadata, and active feature flags.
Include ebpf bytecode bytes, map descriptors (key/value size, type, flags), and any BTF or layout hints needed for precise type tracking.
Output contract
The API returns structured data: an accept/reject flag, an accepted states summary, or precise rejected instruction details.
Rejected entries carry an instruction offset, a stable error string, and supplemental information for operators to triage failures.
Versioning and trust rules
I version the rule set to handle kernel changes: helper IDs, allowed args, and feature flags travel with the response. That prevents mismatches across releases.
Finally: helper rules remain kernel-authored. External analysis may compute likely outcomes, but the kernel validates helper availability, argument types, and function calls before final acceptance.
| Field | Purpose | Kernel check |
|---|---|---|
| bytecode | Program bytes to analyze | Match length and checksums |
| map metadata | Key/value sizes, flags | Validate FD and layout |
| states / error | Accepted types or fail offset | Reproduce error text and state |
Operators rely on repeatable messages—so keep error text stable or version it. For implementation notes and examples, see create-ebpf-ids-on-linux.
Keeping helper functions and function calls safe under offload
I built an analysis that checks every helper use and function call against kernel rules. The tool must prove each call site is allowed for the program type and that argument types line up with kernel expectations.
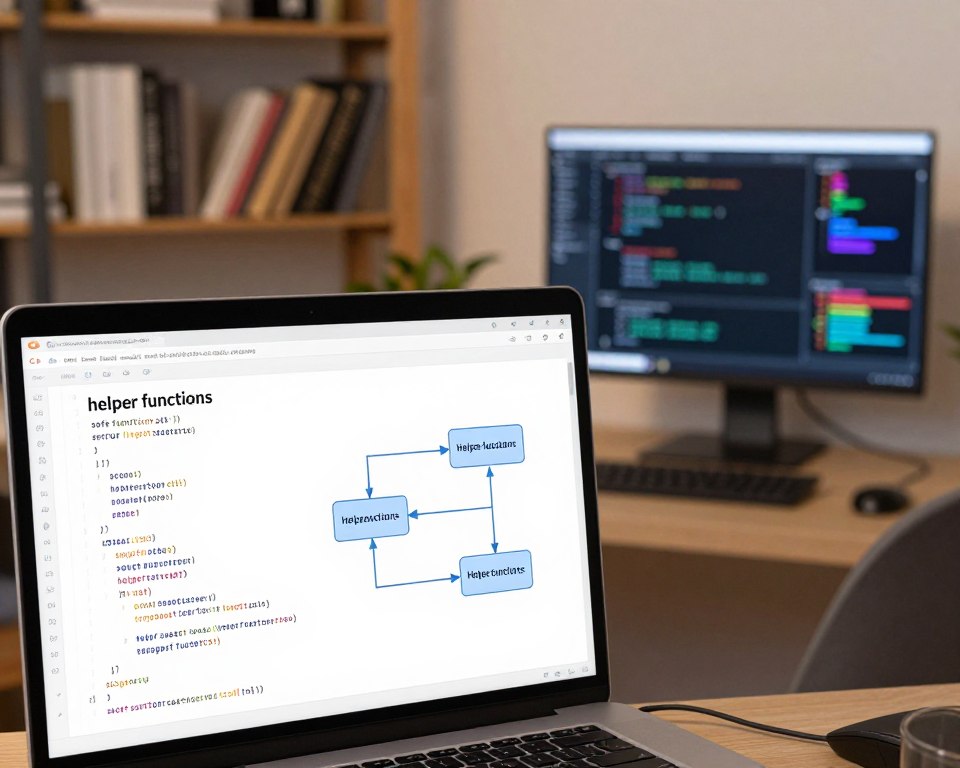
Per-program helper availability and argument types
Helpers are not normal kernel calls. I enforced an allowlist per program type. Each reported call carried the argument types inferred from register tracking. The kernel then rechecked those types quickly.
Validating function calls and call-depth rules
I validated direct calls and BPF-to-BPF calls. Call depth limits were enforced to stop recursion. At each call site I checked arg count, pointer kinds, and stack usage so returns stayed safe.
Using BTF for layout and kfunc checks
I used BTF to match map value layouts and kfunc parameter signatures. Callbacks got extra scrutiny: helpers that invoke callbacks must include the expected callback signature and the assumed state when invoked.
| Check | Off-path analysis | Kernel sanity check | Fail mode |
|---|---|---|---|
| Helper allowlist | Program-type based | Compare IDs to kernel policy | Reject with stable message |
| Argument types | Register-tracked types | Quick re-eval of types | Reject or remap |
| Call depth | Static depth count | Enforce kernel depth cap | Reject on overflow |
| BTF layouts | Map/kfunc structural check | Validate BTF presence and fields | Reject if mismatch |
Handling maps and shared state without creating new attack surfaces
I consider maps a critical attack surface: they hold state, carry data, and grant influence to any process that holds an FD. Treat them like a socket or a file—privileged access changes behavior fast.
What maps do and why I care
Maps are kernel-to-user key-value stores. They provide persistent program state and a channel for user processes to influence kernel logic.
I audit every map for ownership, allowed updates, and intended lifetime. Small mistake and a process can change program decisions at runtime.
FDs, enumeration, and concrete risks
File descriptors matter. If an attacker gets a FD, they can update values and change control flow.
GET_NEXT_ID and OBJs make enumeration possible for privileged processes. That makes FD handling a security-sensitive design point.
Hardening steps I used
- Strict ownership checks on map ops—reject non-owners for sensitive maps.
- Pinning policies to limit who can reference a map from /sys or bpffs.
- Audit logs for create/update/delete events so incidents are traceable.
Tying maps back to external analysis
The external analyzer needed map metadata to model state. I passed only descriptors—no live FDs or secret info.
The kernel retained final FD validation and permission checks at load time. That prevents the analyzer from becoming a new leak path.
| Risk | Mitigation | Kernel role |
|---|---|---|
| Unauthorized updates | Ownership checks, audit | Enforce permissions on BPF_MAP_UPDATE_ELEM |
| Map enumeration | Restrict GET_NEXT_ID visibility | Limit ID access to privileged processes |
| Freezing abuse | Policy for BPF_MAP_FREEZE | Allow freeze only with cap checks |
Complexity limits, bounded loops, and how offload changes the math
I watched how small code patterns explode into huge verifier work queues—and I learned to count real cost, not just lines.
The verifier tracks more than length: it counts instructions inspected across branch and loop permutations. Every branch can fork the current state. Loops replay those forks multiple times, so a short loop can mean thousands of internal checks.
Example: a loop with a moderate bound and two conditional branches per iteration multiplies inspected instructions by the loop bound. I saw programs where a dozen lines produced tens of thousands of inspected instructions.
Moving heavy analysis out reduced wall-clock time on the loader—but it did not remove the need for hard caps. The kernel still enforces instruction and queued state limits to prevent DoS.
| Metric | Effect | Kernel role |
|---|---|---|
| Instructions inspected | Grows with branches × loop iterations | Counts toward cap; reject on excess |
| Queued states | Fork per branch; multiplies in loops | Limited to bound explosion |
| Load-time CPU | Shifted to external analyzer if used | Kernel still rejects over-budget work |
The goal: lower load time and improve overall performance without shifting risk to runtime. Keep limits; keep the kernel as the final guard.
Tail calls as a design tool when verification cost is the real bottleneck
Tail calls let me split complex logic into many small programs so each stays under the verifier’s caps.
How tail-called programs load and verify separately
Tail calls transfer control like a goto—no normal stack frame. Each called program is loaded and verified on its own.
That means complexity and queued state are charged per program, not summed into the caller. It gives immediate headroom for large decision trees.
When tail calls help — and when they hurt
They help when branching and loops explode verifier states. Split a big classifier into a tiny hook program and several handlers. Each handler verifies quickly.
They hurt debugging and tracing. Execution hops across program IDs and failures look like missing targets or mis-wired maps.
- Use tail calls to reduce per-program verification pressure and improve load-time performance.
- Verify tail call map setup and program IDs before flipping to production.
- Keep handlers focused—one job per program eases reasoning and testing.
| Aspect | Benefit | Tradeoff |
|---|---|---|
| Verification cost | Reduced per program | More programs to manage |
| Debugging | Smaller failure surface | Harder to trace across IDs |
| Operational checks | Map and ID validation | Deployment ordering required |
Verifier-driven optimizations you must account for
Verifier-driven rewrites change what the loader and runtime actually execute. The kernel does more than check safety: it can remove or rewrite code to guarantee safe execution. Your external tool must model those edits to match the kernel’s final behavior.
Dead code handling began as NOPing unreachable paths (v4.15) and later became removal with jump recalculation and BTF line fixes (v5.1). This is safety work—not a neatness pass: leaving unverified paths as executable machine code is a risk.
Conditional branches can be rewritten into unconditional jumps. That changes branch prediction and improves runtime performance. It also alters which states the kernel deems reachable—my analyzer must mimic that rewrite logic.
Global functions (v5.6) let the verifier reuse a verified function once and avoid repeating checks at each call site. That speeds verification for large programs and changes per-call bookkeeping.
Helper-driven callbacks (v5.13 and later) introduce implicit control-flow edges: a helper may call back into BPF code. Model those callback paths; otherwise your analyzer will miss reachable instructions and disagree with kernel accept/reject results.
Bottom line: the external component must preserve the kernel’s transformed semantics. If it does not, the kernel will reject or flag mismatches. For guidance on complementary runtime checks, see add runtime enforcement.
Testing strategy for correctness, safety, and regression resistance
I built a test suite that treats the kernel and the analyzer as black boxes and compares their outputs for every program.
Golden tests are my main safety net. For each ebpf program I compare accept/reject, the failing instruction index, and the exact error string the kernel prints. That catches mismatches operators rely on.
Negative tests exercise pointer bounds, uninitialized stack reads, and invalid context access. I feed programs that should be rejected and confirm both tools flag the same fault and message.
Coverage goals
- Helper calls: wrong arg types or helpers not allowed for the program type.
- Map lookups: missing null checks and metadata mismatches.
- Context access: invalid field dereferences by hook type.
- Near-miss examples: safe range-narrowing cases that exposed analyzer bugs.
| Test type | Compare | Expected failure |
|---|---|---|
| Golden accept/reject | Kernel vs analyzer verdict and message | Mismatched decision or text |
| Pointer bounds | Out-of-range access attempts | Rejected for memory access |
| Uninit stack | Reads before writes | Rejected for uninitialized read |
| Map & helper | Null checks and helper args | Rejected for missing null check or helper misuse |
I keep tests small, reproducible, and versioned. Each example ships with the bytecode, the expected kernel text, and a clear pass/fail verdict so regressions are obvious and fast to triage.
Measuring performance: what to time, what to log, and what to optimize
Measuring real impact means separating what runs at load from what runs when a hook fires. I timed the loader path and the hook path independently so I could see where wall-clock time mattered.
Separating load-time cost from runtime cost at hook execution
I recorded two buckets: load-time work (parse, analysis, compile) and runtime execution when a hook fires. That split showed if a change shifted cost into the hot path.
When load got faster but runtime slowed, I treated it as a bug—unless I could explain the trade and accept the performance hit.
Metrics tied to verifier work: instructions inspected, states queued, branch pruning
I logged three tight metrics that mapped to real CPU work:
- Instructions inspected — total inspected across all paths.
- States queued — how many forked states the tool processed.
- Branch pruning rate — fraction of branches eliminated by analysis.
Those numbers drove my optimizations: reduce branching, simplify range math, or split logic into smaller programs.
JIT visibility and confirming you did not reintroduce runtime checks
I compared generated machine code hashes across runs on the same kernel and attach point. Same program, same maps, same kernel build. Identical code proves I did not sneak checks back into the hot path.
| Metric | What I logged | Why it matters |
|---|---|---|
| instructions inspected | count per program ID | maps to CPU work in analysis |
| states queued | peak and total | indicates branch explosion |
| repro data | program type, map metadata, offset | enables repeatable triage and information sharing |
I collected enough data to reproduce slow cases and to explain optimizations. That made performance work repeatable, measurable, and auditable in the kernel and in my lab.
Shipping the change without surprising operators
I shipped this change with operator controls first: feature flags, staged enablement, and a hard rollback path. The kernel stayed the final authority for accepting any program. That meant the external analyzer could speed analysis but never replace the kernel’s final check.
Safe rollout controls
I gated deployment behind a feature flag and staged it per cluster. I required a fallback: if the external service failed, timed out, or returned invalid data, the kernel fell back to in-kernel verification every time.
I also added a debug mode that logged both decisions—kernel-only vs offload-assisted—so I could spot drift fast.
Operational signals and logs
- Reject logs with stable error text and instruction offsets.
- Counters for limit hits and reject rates per program type.
- An explicit “offload active” indicator in system logs for quick triage.
| Signal | Purpose | Operator action |
|---|---|---|
| Reject message | Explain why kernel refused | Inspect bytecode and maps |
| Limit-hit counter | Show verifier pressure | Refactor program or enable debug |
| Offload health | Service timeout / error rate | Switch to kernel-only mode via sysctl |
I treated security as a rollout constraint: no unprivileged user loads until the trust model proved stable. I kept a single sysctl to disable the feature—no rebuilds, no late-night surprises.
Next steps for production-grade offload work in real eBPF deployments
I would treat the external analyzer as a kernel-adjacent subsystem: strict versioning, health gates, and a documented failure path. Keep a fast fallback to in-kernel checks so operators never lose safety.
Validate correctness across kernel releases by running the same ebpf programs on multiple Linux versions and comparing accept/reject decisions. Gate features by kernel version and feature probes—don’t guess helper or context layouts.
Protect the system under load: rate-limit analyzer requests, enforce tight time budgets, and let the kernel hold final limits on instruction and queued state counts. Log clear reject messages and counters that separate analyzer errors from genuine kernel rejects.
Focus targets: network hooks (XDP/TC), observability events (tracepoints/kprobes), and security programs that cannot accept false positives. Test sharp edges: map enumeration, map freeze, and access-pattern changes.
Measure success by reduced load time and unchanged runtime execution at each hook. Ship with documented APIs, reproducible tests, and a simple switch to disable the path if anything looks wrong.
